Novelty Effect Is Not Real!
Or at least, the things that usually makes people think it is real, are not backed by data
There are SO MANY articles online warning CROs about it
It doesn't exist anymore than Nessie or Baba-Yaga! let me explain how I am so sure (and then eventually why I am not so sure).
The Novelty Effect Is Not Real

There are literally hundreds (or even thousands?) of articles online warning CROs about The Novelty Effect ™ impacting their experiments. What if I were to tell you that I've never seen one that has any real actual evidence or data to support the existence of it? It doesn't exist!
OK well it might exist in some limited cases and for sure we have to note that absence of evidence is not evidence of absence. Nonetheless I posit my thesis that its existence is
- Overstated: Almost certainly it does not happen as often as people think
- Exaggerated: Almost certainly the effect is not as strong as people think it is
- Scapegoated: Most of the time people are claiming novelty effect they are just trying to explain away results that are against their hypothesis
I believe there are 2 main reasons why people believe in this myth:
- Blame Microsoft
- Blame the tooling
I will explain each of these in more detail in the following slides.
1) Blame The Tooling
Tooling: The Graph That Misleads
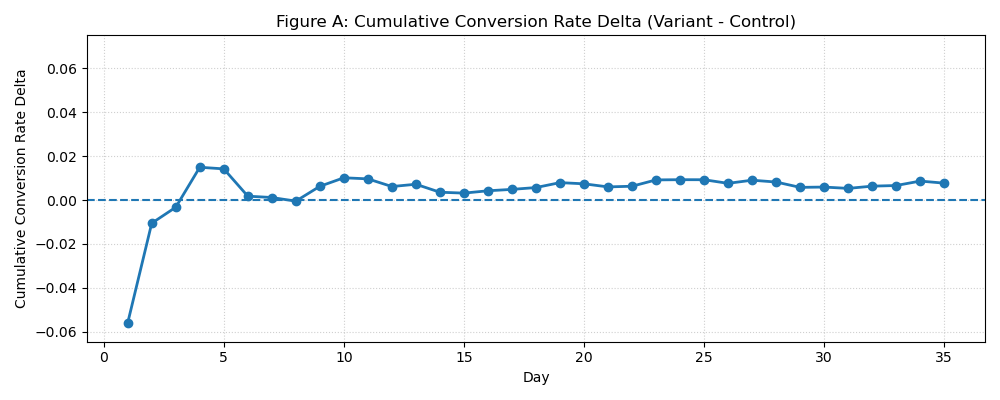
Most of us have a tooling that looks something like this. This is a graph of the performance of our variant over time, as a delta against base/control. The 0 line going straight through the middle represents control/base. The line above 0 means variant is winning, below 0 means variant is losing.
There it is! The Novelty Effect ™ that haunts our dreams! See, I knew it was real….
Not so fast! What do we see here:
- First few days perform badly
- By day 4 we cross the 0 point (experiment is beating control)
- But then we dip under again
- We are stable above the 0 mark (conversion positive) by 9 days
- Volatility reduces over time aka The Novelty Effect ™ is real, right?
Tooling: The Sister Graph
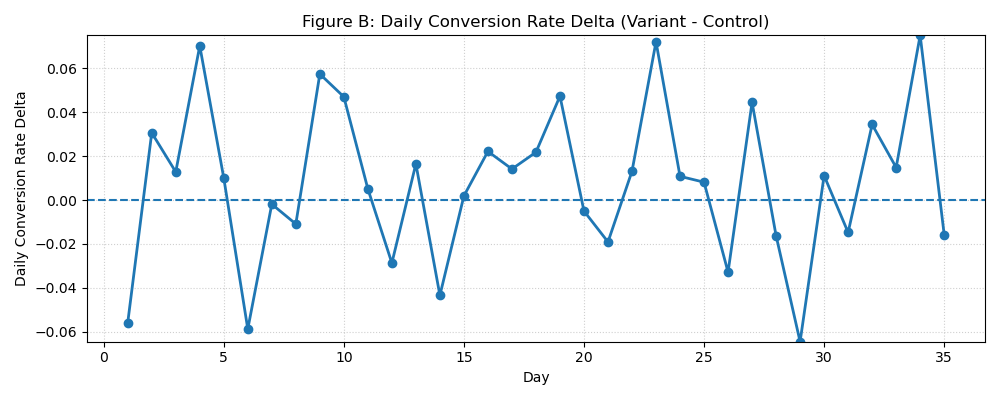
What if I told you that this graph is the exact same data set? It is! The only difference is that Figure A graphs the cumulative data so far, whereas Figure B graphs each day separately.
It paints a very different picture!
Figure A would have us believe that variant performs badly in the beginning, which then normalises as people get used to the change. Figure B shows us that this is not true, in fact people continue to behave with roughly as much variation throughout the test.
The reason Figure A looks like it becomes more stable is because, as each day passes, we have collected more and more data and have established a stable mean. On day 35 (the last day) the day-to-day data is still fluctuating just as much as ever, but this last day is a small part of the overall, so the graph isn't as affected by it.
This is not The Novelty Effect ™ this is simply regression to the mean.
In short: It is Figure A and the prevalence of it that has reinforced the belief that there is a Novelty Effect ™, or at least that it is common.
The Interactive Version: Try it for yourself! Every time you click the button below we simulate a new test data. Both graphs are the same data plotted differently. It's very often the case that the cumulative graph appears to show a novelty effect, which disappears when you look at the day-to-day data.
Click 'Run New Simulation' to see how raw daily changes compare to the smoothed cumulative view.
Data Explained
This button will simulate a run of an AB test, that runs for 35 days, and plots both the cumulative data as well as the per-diem data.
- We generate a "day" of 10,000 visitors in base and variant
- We simulate 25% conversion rate (we're pretending this test is on cart page)
- We apply a randomly decided 15% plus/minus variance to those because people
- We then add 1.805% conversion to our variant, thus simulating an experiment with conversion uplift
- Then we loop all of this 35 times to create 5 "weeks" which is more than enough power for us to be able to detect this uplift
See for yourself, the Figure A graphs often seem to show The Novelty Effect ™, but looking at each day in more detail in Figure B shows this to be simply an artifact of this type of visualisation.
In every simulation, both graphs are showing identical data.
Figure A: Cumulative Conversion Rate Delta
Figure B: Daily Conversion Rate Delta
2) Blame Microsoft
Microsoft: Their paper
Ronny Kohavi is considered by many (including me) to be a legend in the field of AB Testing. He has written many papers, and is a professor at Stanford University. He and the team around him defined a lot of the knowledge we now take for granted in the field of AB Testing, and their work is considered to be the "gold standard" for AB Testing expertise.
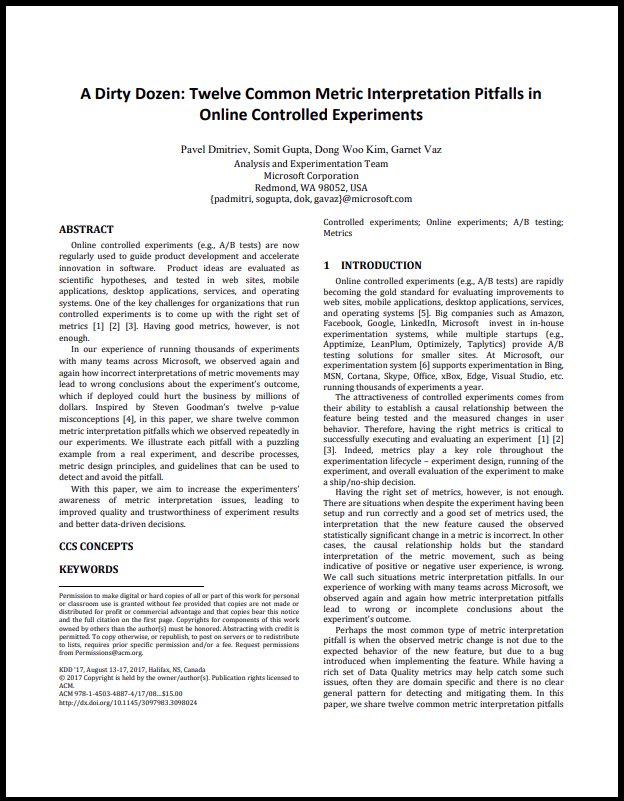
When we talk of a paper on AB testing that comes from Microsoft during his tenure in charge we tend to think of it as carrying the weight of his credibility. But in August 2017 the MS team published a paper titled A Dirty Dozen: Twelve Common Metric Interpretation Pitfalls in Online Controlled Experiments [1]
As far as I can tell, every source online that claims to have actual evidence for the Novelty Effect ™ (not just speculation) is citing this paper.
But let's take a look at it...
[1] To be fair Ronny himself was not an author on this paper, and when he has given presentations based on it he has omitted this part and not included it in his advice.
Microsoft: Pitfall 10 - The Novelty Effect
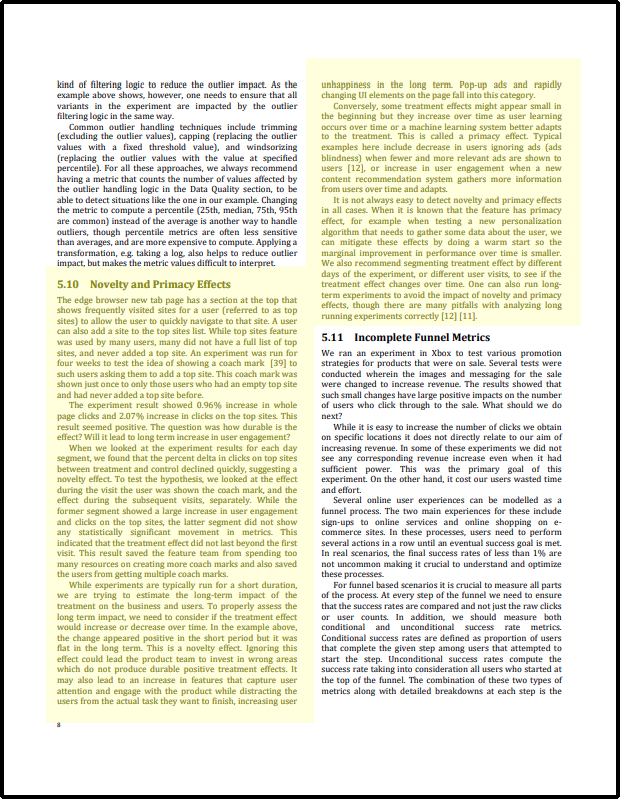
Their evidence on the Novelty Effect ™ comes from one experiment, and it is as follows:
Experiment Summary:
- Edge browser ran a 4-week A/B test showing a one-time coach mark prompting users (with no top sites saved) to add one.
- The coach mark was shown only once per user, during their first eligible visit.
Findings:
- Users who saw the coach mark had:
- +2.07% clicks on top sites
- +0.96% clicks overall
- The effect only occurred during the visit when the coach mark was shown.
- On subsequent visits (no coach mark shown), the uplift disappeared.
Key takeaway:
- The feature only had an effect when visible.
- Authors describe this as a "novelty effect", but it's more accurately a single-exposure effect — not evidence of fading engagement with a persistent feature.
Comments on the experiment
While there are no doubt important learnings to be had here, it is in no way evidence that users respond differently to a change when they first see it, and then differently later. The users in this experiment behaved differently on repeat visits because they were not shown the coach mark. It's that simple.
Even if this experiment did show evidence of The Novelty Effect ™ (which it does not), it is in no way evidence that it is a common phenomenon.
This is a very specific experiment, on a browser that most people in the test are using all the time. The test is on the new tab page, which the users will see many many times every day. The users in this test are far more strongly conditioned to expect base than an eCom site's users are, thus it is not a generalisable experiment.
Conclusion
So Novelty Effect Is A Complete Myth And It Never Happens?
Well. Are there some cases where a website has a very loyal customer base who are very used to the status quo, and a variant might be a jarring change that they need time to get used to? It is definitely theoretically possible, but finding any evidence for it actually happening in the real world is extremely rare (honestly I don't think I have ever seen strong evidence of it, in 20 years of AB Testing).
So theoretically possible yes, but it is (by far) the exception, not the rule. More often than not "it's the novelty effect" is simply used by people to explain away results that are not as they had hoped.
Most of all we need to remember, that there seem to be two main things reinforcing the belief in The Novelty Effect ™ and both of them are demonstrably red herrings.
- The Tooling - The type of graph we see in Figure A should NOT BE INTERPRETED as evidence for that, because it is not. It is just regression to the mean.
- The Research Paper - The research paper cited above is a red herring, not evidence for the Novelty Effect ™.
If you have a particular reason to believe your experiment has The Novelty Effect ™, then you may want to look at the day-by-day results. The most likely thing you will see is that your daily volatility does not change much over the runtime, implying that there is little or no novelty effect. The users behave just as erratically from day 1 to day 2 as they do from day 30 to day 31.
Side Note: "Trending" Is Also A Myth
Go back and run the simulation a few times: You won't have to wait long before you see some examples that start very poorly, but finish positive; or the opposite.
Remember we have hardcoded in a conversion uplift, equally on every day, so we know there is no possibility for the results to be trending up or down over time. The results have the same conversion multiplier applied every day, the only difference is the day to day randomness.
All that is happening is that they are taking longer to regress to the mean. This is totally normal, it happens on most experiments. Because the graph is below the line for 3 weeks and then above the line at the end does not mean the result is trending. It certainly does not imply that trend will continue.
See this example below
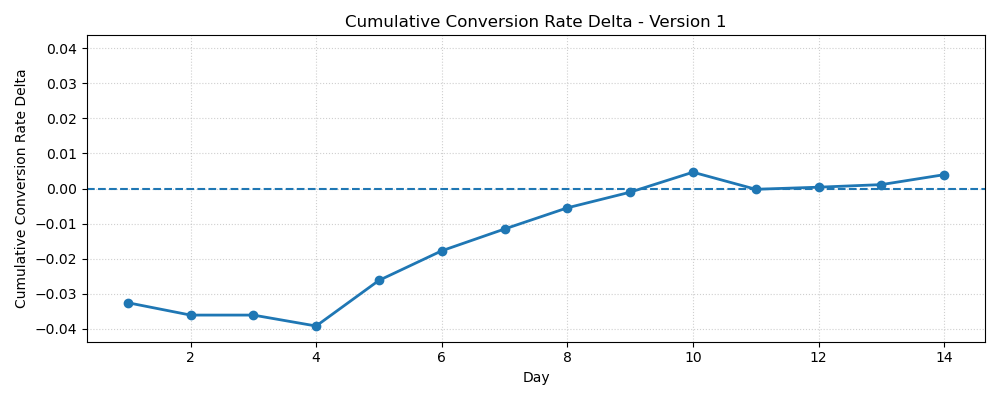
Have a look at this one. It's trending up right?
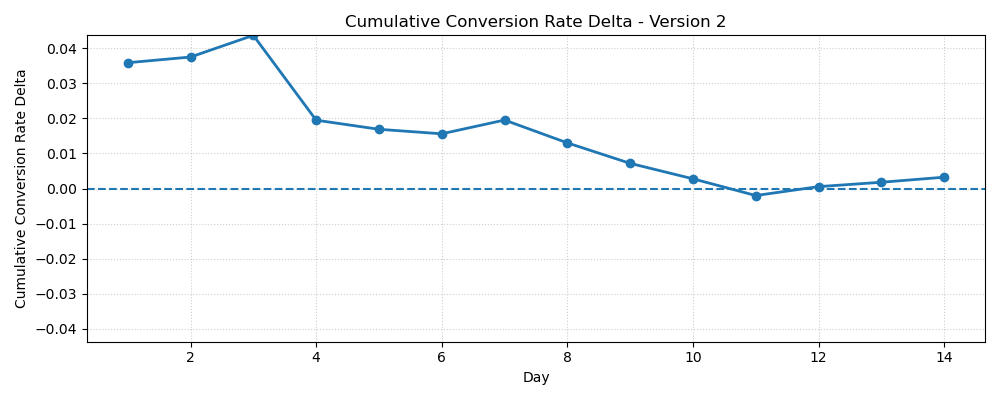
What about this one? Trending down?
Maybe you know what I'm going to say next. They're both the same experiment, just plotted differently!
In this experiment the variant performed well for week 1, and then not so well for week 2. In the graphs I just swapped week 1 with week 2.
In truth these type of graphs are in the tooling only because people like to see them, but actually they are quite useless. They are not a good way to judge the performance of an experiment.
The only thing that matters is the last data point. The last one is an average of everything you have collected so far, so is the most representative thing you can look at. Everything else is just building a realistic mean.